Regional Expansion: The Untapped Opportunity in Underserved Suburbs Measuring, Analysing, and Using Performance Data for Growth(2)
By Brendan Byrne - CEO Tuesday, December 9, 2025
Measuring, Analysing, and Using Performance Data for Growth
In today’s competitive service landscape, growth is no longer driven by intuition alone. The businesses that scale predictably – and profitably – are the ones that understand their numbers and use them to guide decision-making. Whether you're a growing agency, a consultancy, or a service provider aiming to optimise operations, performance data is the key to unlocking long-term success.
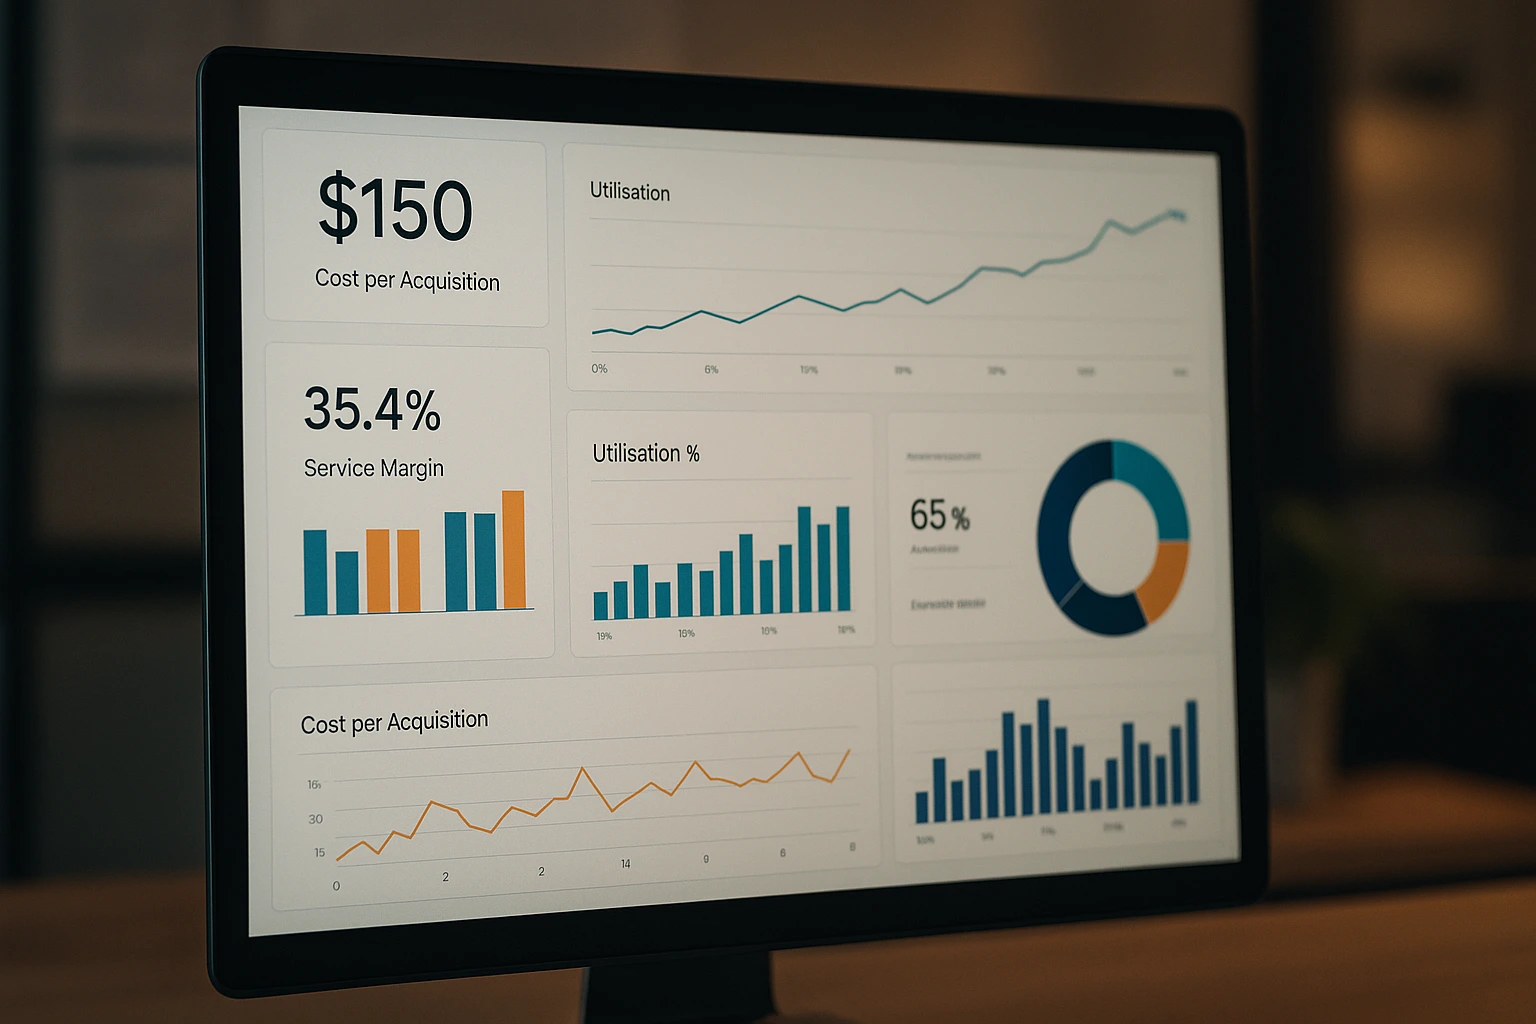
Among the most powerful metrics for service-based businesses are Cost Per Acquisition (CPA), Service Margin, and Utilisation. Individually, they reveal important financial and operational truths. Together, they form a complete picture of how efficiently your business attracts, services, and retains clients.
This article breaks down how to measure, analyse, and use each metric – and how systems such as those built by One Orange Cow can help you turn data into direction.
1. Cost Per Acquisition (CPA): Measuring the True Price of Growth
CPA shows how much it costs your business to acquire one new customer. It is one of the most essential marketing and sales metrics, yet is often misunderstood or under-utilised.
How to Calculate CPA
The formula is simple:
CPA = Total Sales & Marketing Costs ÷ Number of New Customers Acquired
For example, if you spent $5,000 on campaigns and sales activity in a month and gained 10 new customers, your CPA is $500.
Why CPA Matters
A strong CPA gives you clarity on:
- Whether your marketing channels are performing efficiently
- How much you should confidently spend to scale
- Whether your sales process is converting at a healthy rate
- Which customer acquisition activities should be prioritised or cut
Most importantly, CPA only becomes meaningful when compared to Customer Lifetime Value (CLV). If your CPA is higher than the profit you earn from each customer, your growth strategy will eventually run into trouble.
How to Analyse CPA Over Time
Instead of looking at CPA as a single number, track:
- CPA by channel (Google Ads vs. Meta vs. SEO)
- CPA by campaign
- CPA by customer type
- CPA monthly or quarterly
This helps identify trends, seasonality, and the activities that deliver the highest return.
Using CPA Data to Make Decisions
Once you know your CPA, you can confidently:
- Allocate budget to the channels that deliver the best cost-to-return ratio
- Improve your sales process to lift conversion rates and reduce acquisition cost
- Build targeted campaigns around high-value customer segments
- Forecast growth without the risk of overspending
Systems like the marketing and sales automation platforms implemented by One Orange Cow help businesses track channels accurately, refine campaigns, and lower CPA over time by improving every step of the customer journey.
2. Service Margin: Understanding Profitability at the Delivery Level
While CPA focuses on the cost of winning a customer, Service Margin reveals whether servicing that customer is actually profitable. For service-based businesses, this metric determines sustainability.
How to Calculate Service Margin
For each service, productised offer, or client engagement:
Service Margin = (Service Revenue – Direct Service Costs) ÷ Service Revenue × 100
Direct service costs include labour, contractor fees, software tied to delivery, and any other expenses directly linked to performing the service.
Why Service Margin Matters
High revenue doesn’t always equal high profitability. A business may be growing quickly yet unknowingly eroding margin through:
- Over-servicing clients
- Under-quoting
- Inefficient processes
- High labour costs relative to output
- Scope creep without corresponding price adjustments
Service Margin highlights these dangers early.
How to Analyse Service Margin
Break margins down by:
- Service type
- Delivery team
- Project or client
- Time period
This level of analysis reveals where margin is strong and where it’s being diluted.
For example, you may discover that your flagship service is profitable, but your add-on service drains resources and lowers overall performance. Or that certain types of clients consistently require more hours than your estimates account for.
Using Service Margin Data to Make Decisions
Once margins are understood, you can:
- Adjust pricing to reflect real costs
- Improve delivery processes to increase efficiency
- Redefine scope or service tiers
- Stop offering low-margin services altogether
- Train teams to reduce labour hours and eliminate bottlenecks
A well-structured CRM and project management ecosystem, such as those built by One Orange Cow, makes margin tracking reliable by connecting sales, delivery, and time tracking. When the data is visible and accurate, pricing and resourcing decisions become far easier and more confident.
3. Utilisation: Measuring Productivity and Capacity in Service Teams
Utilisation measures how effectively your team’s available work hours are being used for productive, billable tasks. For service businesses, it is the heartbeat of operational efficiency.
How to Calculate Utilisation
Utilisation can be measured per team member or across the business:
Utilisation Rate = (Billable Hours ÷ Total Available Hours) × 100
A full-time staff member generally has about 37.5–40 hours a week available. But not all of that is billable. Admin, training, internal meetings, and development work must be factored in.
Ideal Utilisation Rates
While ideal rates vary, here are common benchmarks:
- 70–80% for balanced service teams
- 80–90% for highly efficient agencies or consultancies
- 60–70% for roles with mixed delivery and admin duties
Rates consistently below target may indicate a lack of work, poor workflow management, or inefficient scheduling. Rates consistently above target may signal burnout risks or under-resourcing.
Analysing Utilisation
Track utilisation by:
- Individual team members
- Roles (designers vs. developers vs. strategists)
- Teams or departments
- Service type
- Week / month / quarter
Like CPA and margin, utilisation becomes powerful when reviewed over time.
Using Utilisation Data to Make Decisions
With accurate utilisation data, you can:
- Improve resource planning
- Identify team members who are over or under capacity
- Streamline workflow processes
- Identify where automation or outsourcing may reduce pressure
- Make informed hiring decisions based on actual demand
Tools integrated through One Orange Cow allow businesses to automate time tracking, capacity management, and workflow allocation – turning utilisation into a real-time performance indicator rather than a once-a-month guess.
Bringing It All Together: Creating a Data-Led Growth Engine
CPA tells you the cost of winning a client.
Service Margin tells you how profitable it is to deliver the service.
Utilisation tells you the efficiency of your team.
When combined, these three metrics enable you to:
- Forecast revenue and staffing needs
- Scale confidently without eroding margin
- Identify which services to expand or discontinue
- Allocate resources effectively
- Adjust pricing and packaging
- Build growth plans grounded in real performance data
With the right digital systems—CRM, automation, reporting dashboards and delivery tools—business owners gain complete visibility across the entire customer journey. If you're ready to align your marketing, sales, and operations with stronger data, partnering with a strategic digital agency like One Orange Cow can help you implement the structure and reporting needed for predictable, scalable growth.
Explore how their strategies and systems support businesses here: https://www.oneorangecow.com